
It’s no secret that the solar energy industry is booming. Homes and businesses everywhere are installing solar systems, making the transition to renewable energy and saving big on electricity.
Over the past couple of decades, we’ve accumulated enough data to tell a compelling story about solar energy and its impact. The following 56 solar energy statistics are a reflection of where the solar industry is right now and where it’s expected to go.
Table of contents:
- General Solar Energy Statistics
- Cost of Solar Energy Statistics
- Solar Energy Job Statistics
- U.S. Solar Energy Statistics
- Global Solar Statistics
- Solar Energy Growth & Potential Statistics
- The Power of Solar
- Solar Energy vs. Fossil Fuels Statistics
- Non-Residential Solar Statistics
- One Average Home Going Solar for a Year…
General Solar Energy Statistics
To kick things off, let’s take a look at some general solar power statistics that shed light on what solar energy is.
1. As of 2021, solar PV is renewable energy’s fastest-growing sector. (International Energy Agency)
2. Solar energy accounted for about 2.8% of total U.S. energy in 2021. (U.S. Energy Information Administration)
3. The majority of solar panel components are recyclable, with glass composing 75% of a panel’s weight, and other recyclable materials, like aluminum and copper, also making up a significant portion of its structure. (EPA)
4. Solar panel efficiency has increased nearly eightfold since 1954, from 6% to over 47% in the most efficient modern panels. (American Physical Society and Springer Nature)
5. Between 1970 and the early 2000s, solar cell efficiency rose from 17% to 25%. (ScienceDirect)
6. Despite an average lifetime expectancy of 25-30 years, solar panel systems from the 1980s (over 35 years old!) are still operating very efficiently. (University of Oldenburg)
7. Of the four states with the highest community solar production as of December 2021, three (Minnesota, New York, and Massachusetts) have fewer sunny days than the national average. Solar proves to still be worth the investment even in cloudy regions. (National Renewable Energy Laboratory)
Cost of Solar Energy Statistics
If there’s one trend that should encourage prospective solar customers, it’s that the price of solar has declined drastically. The following statistics reflect this trend and elaborate on the cost of solar.
8. Over the past decade, the cost to install solar has fallen by over 60%. (Solar Energy Industries Association)
9. The average cost to install a 6 kW solar system has gone from over $50,000 in 2010 to just $20,000 in 2021. (SEIA)
10. Hardware is not the biggest expense involved in solar panel installation — soft costs like permitting and installer margin now constitute 65% of total system cost. (SEIA)
11. Between 2010 and 2020, the cost of electricity from concentrating solar-thermal power (CSP) plants declined by over 50%. (NREL)
12. Between 1991 and 2018, the price of lithium ion batteries (the most common batteries used to store solar energy) declined by 97%. (Our World in Data)
Solar Energy Job Statistics
The solar industry employs a lot of people, and that number is only expected to rise with global leaders making pledges to expand renewable energy production. Below, we include some statistics about employment in the solar industry.
13. There are over 230,000 solar workers in the U.S. (Interstate Renewable Energy Council)
14. Of those workers, 67% are directly involved in solar construction and/or installation. (National Solar Jobs Census)
15. “Solar photovoltaic installer” is the fifth fastest growing job in the U.S., with a 52% projected growth rate between 2020 and 2030. (U.S. Bureau of Labor Statistics)
16. Between 2019 and 2020, the number of solar workers declined by 7%, a drop that is primarily attributed to the pandemic. (IREC)
17. California alone is home to nearly 30% of solar jobs nationwide. (The Solar Foundation)
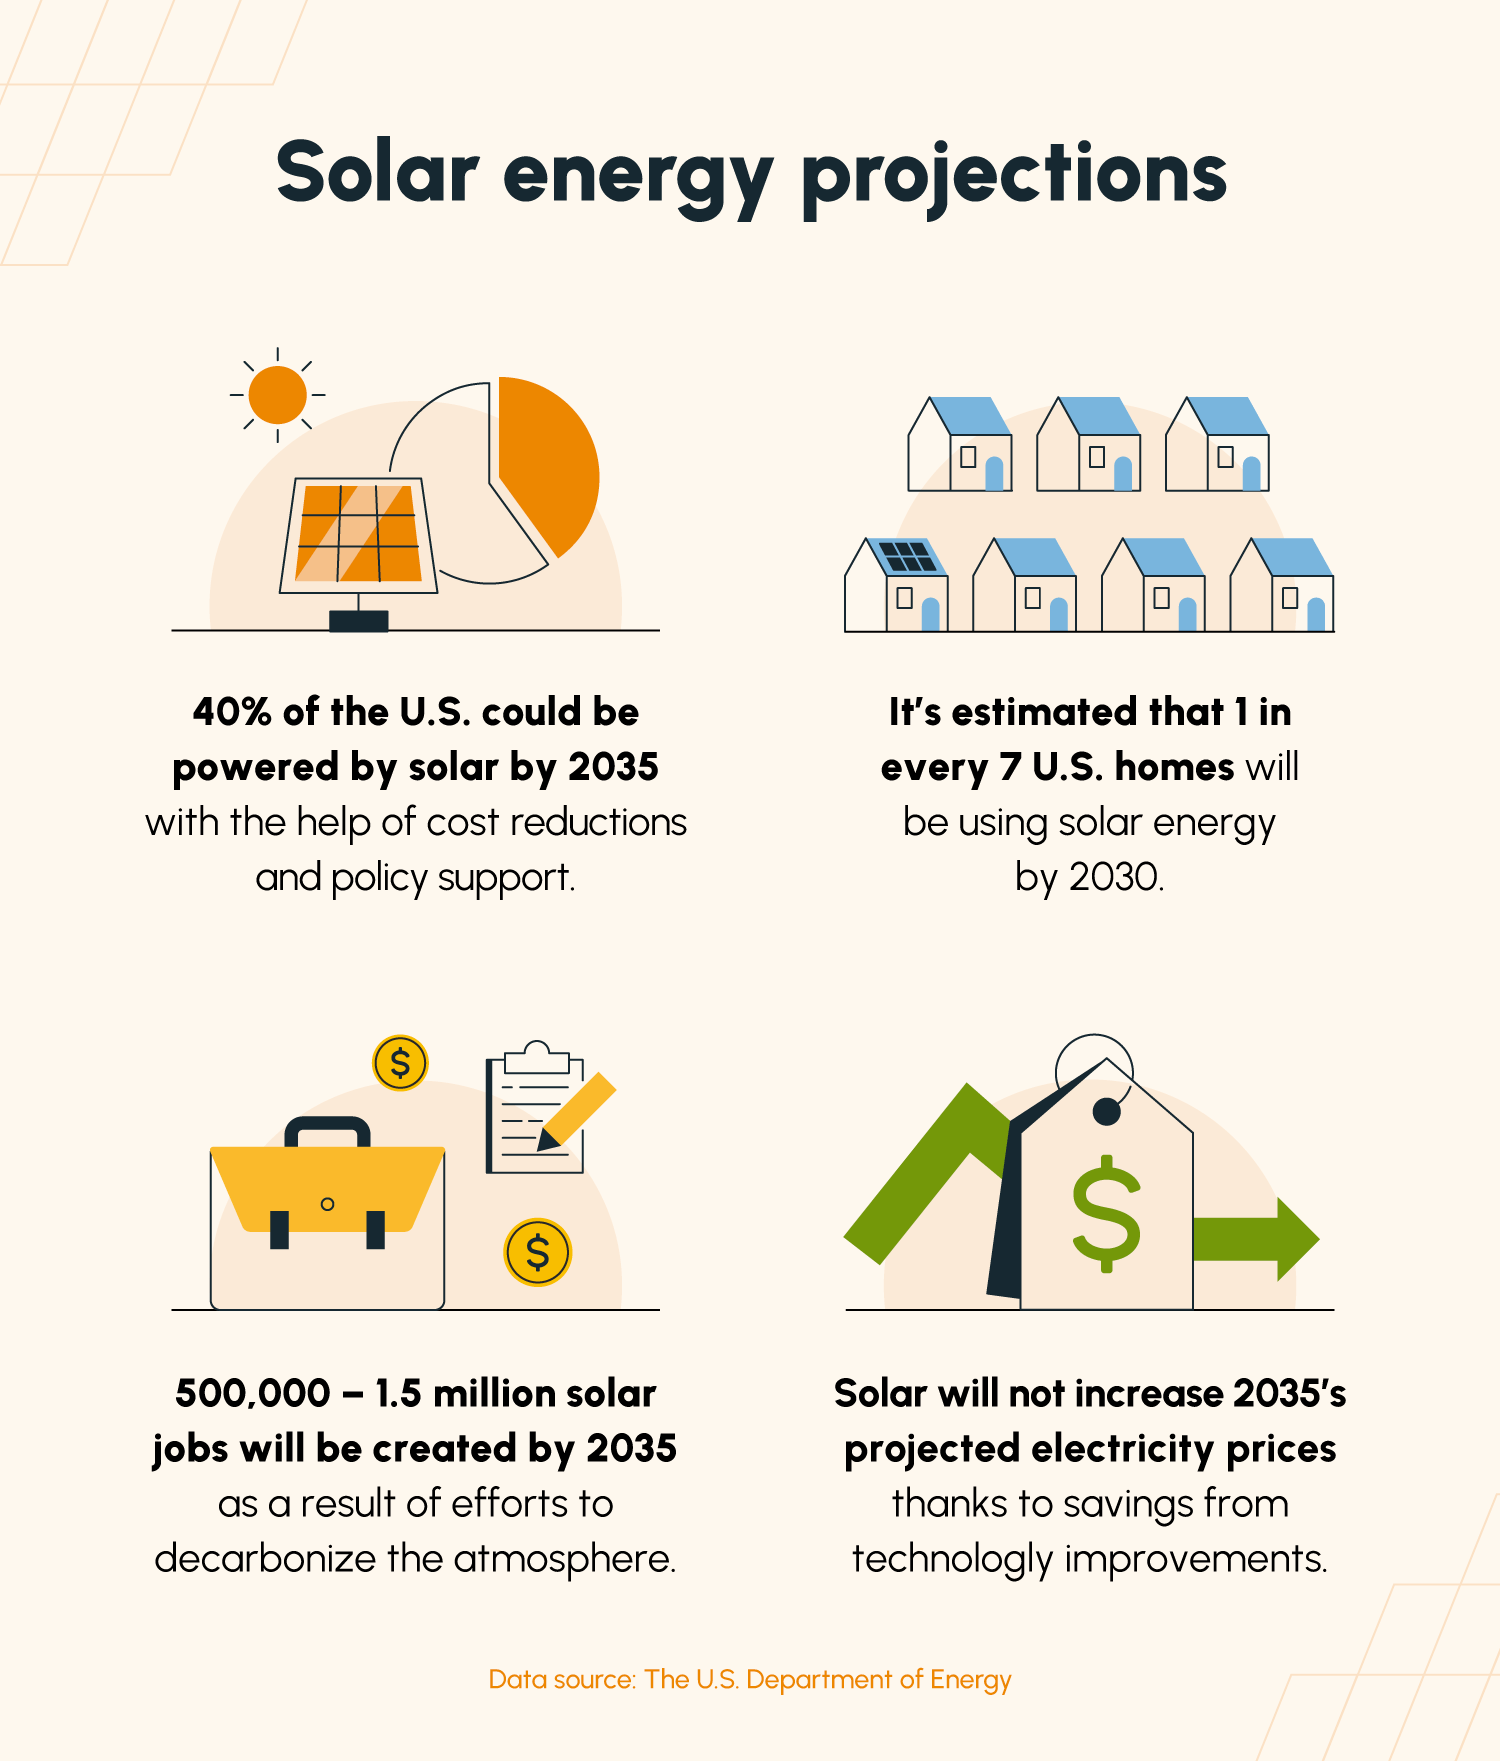
18. By 2035, the U.S. will need over 900,000 solar jobs to achieve President Biden’s 100% clean energy goal. (IREC)
United States Solar Energy Statistics
As a leader on the global stage, the U.S.’s role in solar energy is very significant. Let’s take a look at some statistics that unpack what the U.S. has done recently in the world of solar.
19. Over 1.47 million solar panels are in use across the continental U.S. (Stanford)
20. Solar energy composed 13.5% of U.S. renewable energy production in 2021. (EIA)
21. In Q1 2022, the U.S. installed 3.9 gigawatts (GW) of solar PV capacity — enough to power 22 million homes. (SEIA)
22. Solar also accounted for 50% of all electricity-generating capacity created in the U.S. in Q1 2022. (SEIA)
23. In 2021, 11 states generated over 6% of their total electricity from solar. (U.S. Department of Energy)
24. In 2021, the U.S. installed 18.6 gigawatts alternating current (GWac) of solar energy. (U.S. Department of Energy)
Global Solar Statistics
The impact of solar is felt everywhere in the world — not just the U.S. The following statistics describe the state of solar power around the globe.
25. In 2021, 172 gigawatts direct current (GWdc) of PV capacity was created worldwide. (U.S. Department of Energy)
26. As of 2019, Puerto Rico tops every U.S. state in the percentage of solar jobs held by women at 42.2%. (The Solar Foundation)
27. China has the largest PV capacity globally, with over 250 GW installed — over 2.5 times more than the U.S. (Statista)
28. In 2021, China installed 55 GWdc — about 32% of all PV capacity installed globally in 2021. (U.S. Department of Energy)
29. 2021 saw a global increase in CSP development, with 250 megawatts (MW) added in China and 110 MW in Chile. (U.S. Department of Energy)
30. Another 1.7 GW of CSP is now under construction around the world. (U.S. Department of Energy)
31. Solar, wind, and renewable energy power is most popular in Australia, with 76% of the population believing these energy sources should tackle climate change. (Statista)
32. In 2021, Austria added 740 MW of solar capacity — over twice as much as the previous year — bringing its total capacity to 2.78 GW. (PV Magazine)
Solar Energy Growth & Potential Statistics
It’s no secret that the solar industry is booming. The past decade has seen unprecedented growth in renewable energy sources, and solar is no exception. The following statistics describe solar’s growth as well as where it’s going.
33. In the coming decade, it is projected that 300 GW of solar capacity will be installed — three times the total capacity installed through 2021. (SEIA)
34. The global solar energy market is projected to grow by nearly 60% between 2021 and 2028, from $184.03 billion to $293.18 billion. (Fortune Business Insights)
35. If the Department of Energy’s 2030 cost targets are achieved, estimates show U.S. PV capacity could reach 410 GW by 2030 and 970 GW by 2050. (NREL)
36. It is projected that cumulative global solar PV capacity installations will reach 1,427.75 GW by 2024. (Statista)
37. By 2030, it is projected that 1 in 7 U.S. homes will have a solar panel system installed. (U.S. Department of Energy)
38. Projections from GTM Research suggest that the community solar market could increase 50-80 times by 2030. (Vote Solar)
The Power of Solar
Solar energy isn’t just renewable — it’s powerful, too. After all, in one hour enough solar energy reaches the Earth to power the world for an entire year.
39. There is no energy resource on Earth more abundant than solar energy, with 173,000 terawatts of solar energy hitting the Earth at all times — over 10,000 times humans’ total energy use. (National Oceanic and Atmospheric Administration)
40. It would take about 22,000 square miles of solar panels to power the entire U.S. — that’s only about half a percent of the total land in the U.S. (NREL)
41. Solar-powered heating and cooling systems can produce approximately 80% of the energy used for commercial and residential space and water heating needs. (SEIA)
42. The U.S. solar industry reduces the same amount of emissions as there is carbon in 2 billion trees. (SEIA)
Solar Energy vs. Fossil Fuels Statistics
One of the biggest reasons to go solar is to reduce our carbon footprint as a species. We’ve compiled a few stats about what solar energy has against fossil fuels below.
43. The cost of building new utility-scale solar plants is almost exactly the same as the cost of keeping existing coal plants running, and may even be less expensive in some cases. (Lazard)
44. It would take 21,250 square miles — about half of the land that the oil and gas industry currently leases — to meet all of the U.S.’s electric needs. (NREL and U.S. Department of the Interior Bureau of Land Management)
45.The carbon intensity of solar PV is over 20 times less than that of coal. (NREL)
Non-Residential Solar Statistics
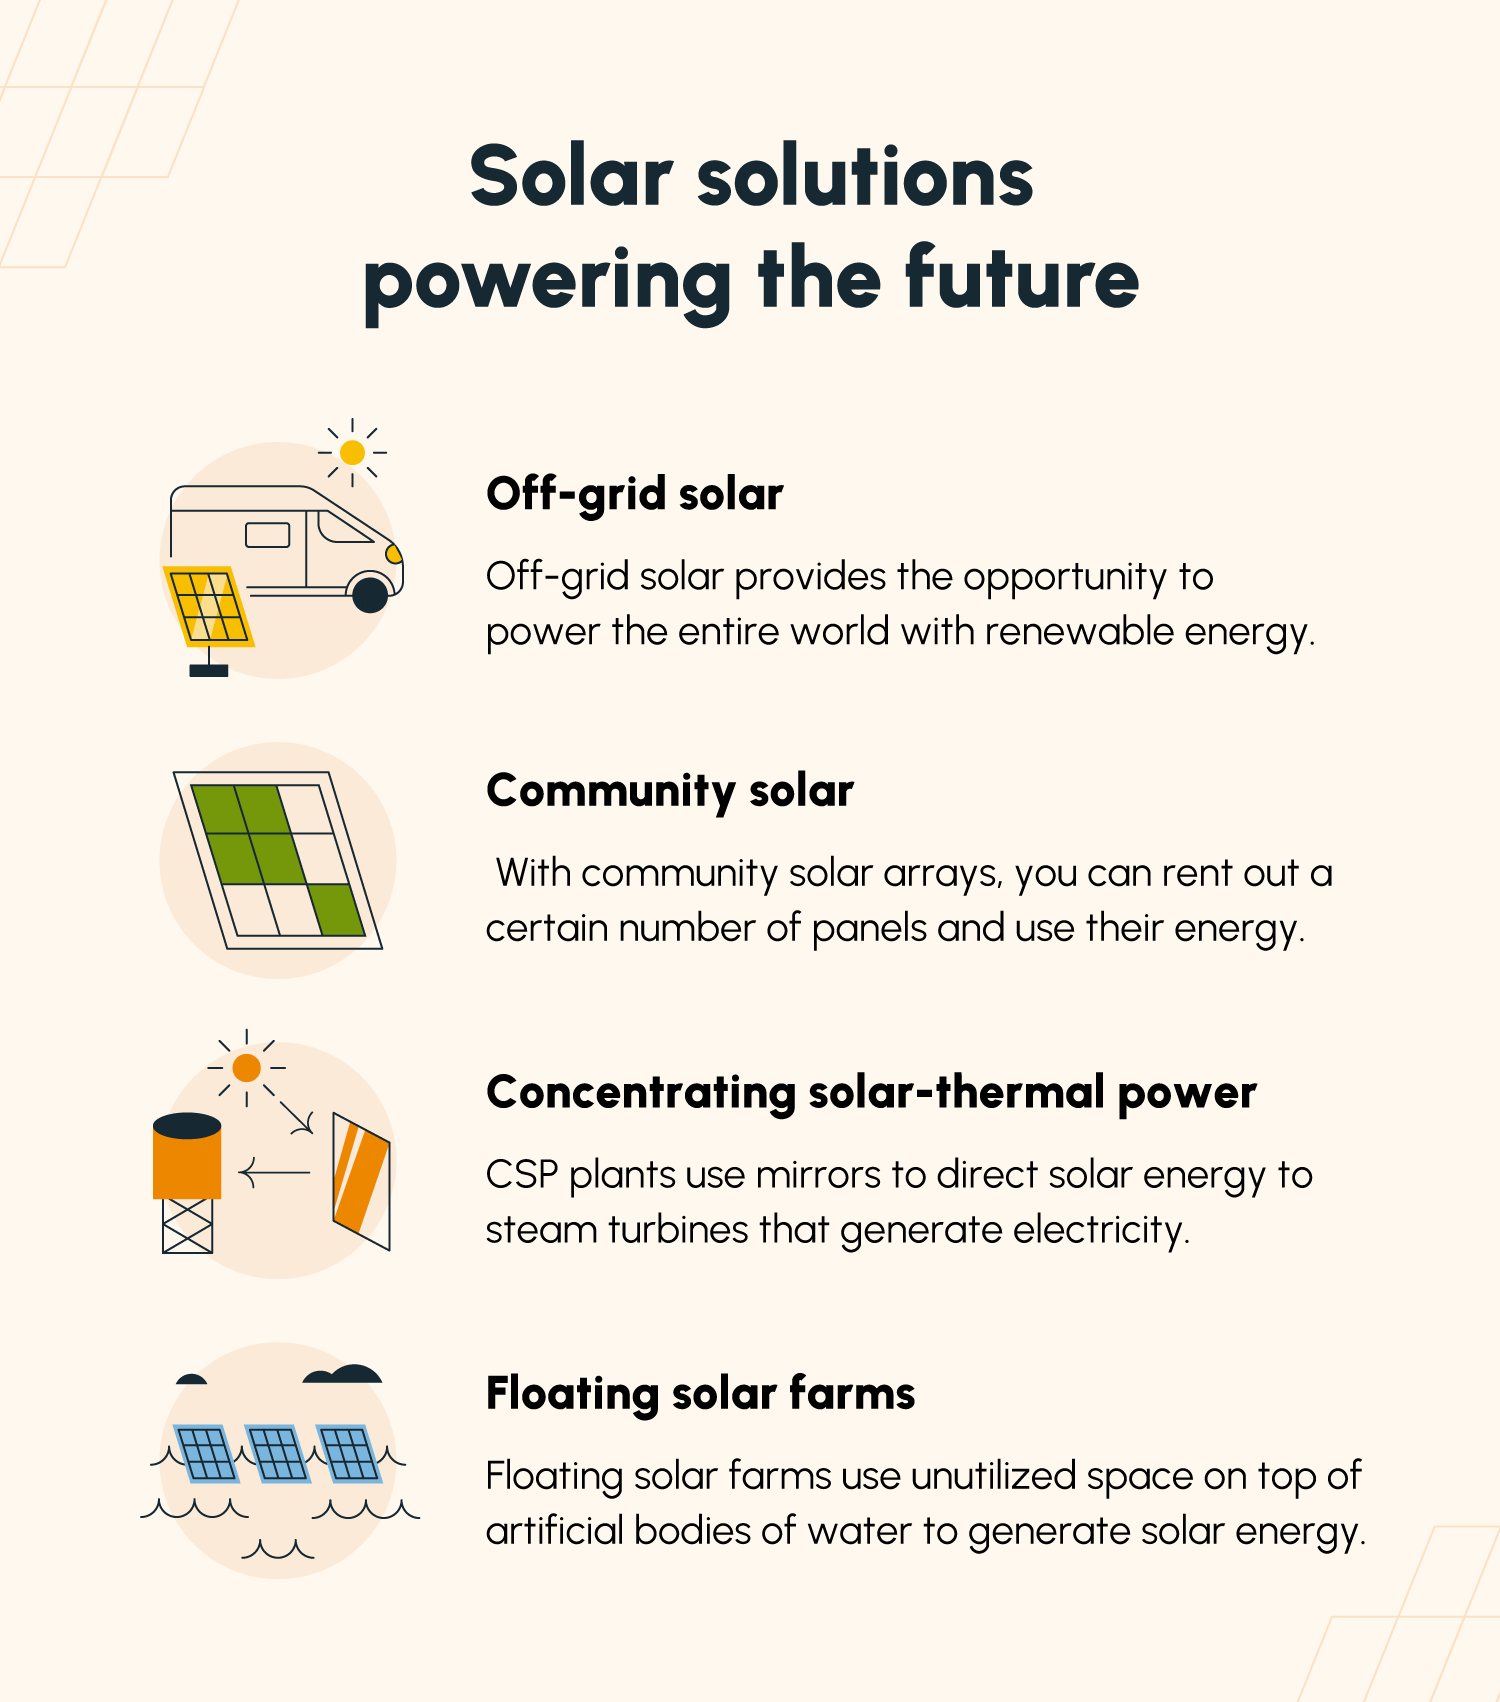
Residential rooftop solar is usually the first thing that comes to mind at the mention of solar energy. However, there are countless other ways to use solar energy, such as off-grid solar, community solar, and commercial/industrial solar.
46. Between 2010 and 2020, the off-grid solar sector has expanded to become a $1.75 billion annual market, providing energy for 420 million individuals. (The World Bank)
47. Achieving universal access to electricity by 2030 would require between $6.6 billion and $11 billion in financing from investments in off-grid solar companies as well as public subsidies. (The World Bank)
48. Since 2016, community solar capacity in the U.S. has increased more than sixteenfold, from over 300 MW to 4,900 MW (4.9 GW) today. (SEIA)
49. By 2027, it is projected that an additional 4.3 GW of community solar capacity will be added in the U.S. (SEIA)
50. Research suggests that installing floating solar farms on just 27% of viable man-made water bodies in the U.S. (such as reservoirs) could provide 10% of the nation’s electricity. (ACS Publications)
51. By the end of 2020, over 20 floating solar arrays had been built in the U.S. — tripling what had been built only two years earlier. (PV Magazine)
52. Offsite corporate procurement is expected to be the largest contributor to U.S. solar capacity in the commercial and industrial sectors in the coming years, adding over 6.7 GW between 2022 and 2024. (Statista)
One Average Home Going Solar for a Year…
53. Keeps 12,500 pounds of carbon dioxide out of the atmosphere.
54. Produces the same amount of energy as burning 8,000 pounds of coal.
55. Saves over 937,000 full smartphone charges.
56. Is equivalent in carbon emission reduction to growing 122 trees.
Note: Data pulled from the EPA’s Greenhouse Gas Equivalencies Calculator.
The expansion of solar power over the past decade is a testament to our innovation approaching renewable (and affordable) energy solutions.
Solartap is committed to making solar as accessible as possible, making it easier than ever to join the movement. Get a quote today using our solar calculator.